
• Skip to primary navigation
  • Skip to main content
  • Skip to primary sidebar
  • Skip to footer
Big Bear Real Estate home
(909) 547-7550 | Login / Register
  • Search
    • Search All Listings
    • Featured Listings
    • Sold Listings
    • Popular Searches
    • Market Reports
    • New Listing Alerts
  • Neighborhoods
  • Blog
  • About
    • About Us
    • Our Team
    • Testimonials
  • Contact
  • Home
  • Search
    • Search All Listings
    • Featured Listings
    • Sold Listings
    • Market Reports
    • New Listing Alerts
  • Neighborhoods
  • Popular Searches
  • Buyers/Investors
    • Invest in Big Bear
    • Buying a Big Bear Home
    • Big Bear Market Reports
  • Sellers
    • What’s My Big Bear Home Worth?
    • Selling Your Big Bear Home
    • Big Bear Market Reports
  • Blog
  • About
    • About Us
    • Our Team
    • Testimonials
  • Contact
  • Login / Sign Up
Big Bear Real Estate
(909) 547-7550 Office
Email

Big Bear Real Estate Market March 2021

April 5, 2021 by Big Bear Real Estate Leave a Comment

Big Bear Real Estate Market Stats for the month of March 2021

Market Wide Summary

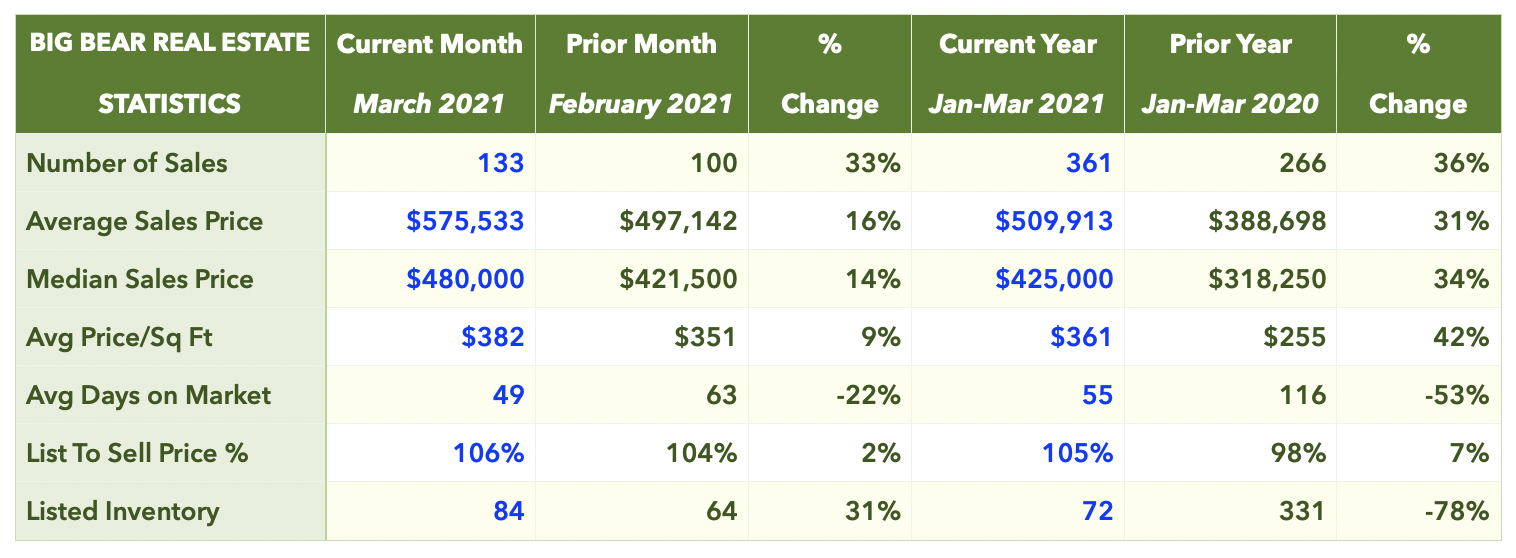
The average sales price of single family homes in Big Bear in March increased by 16% compared to the previous month, and the median sales price was up 14%. Average sales price over Jan-Mar 2021 was 31% higher and median sales price was up 34% compared to the first quarter of 2020.
stats

List Price vs. Sale Price and Days on Market

Properties sold in March went for 106% of the asking price after 49 days on market on average, compared to 104% and 63 DOM in February. The list-to-sell price ratio was 105% on average over Jan-Mar, as compared to 98% over Jan-Mar 2020.

Big Bear Inventory Trends

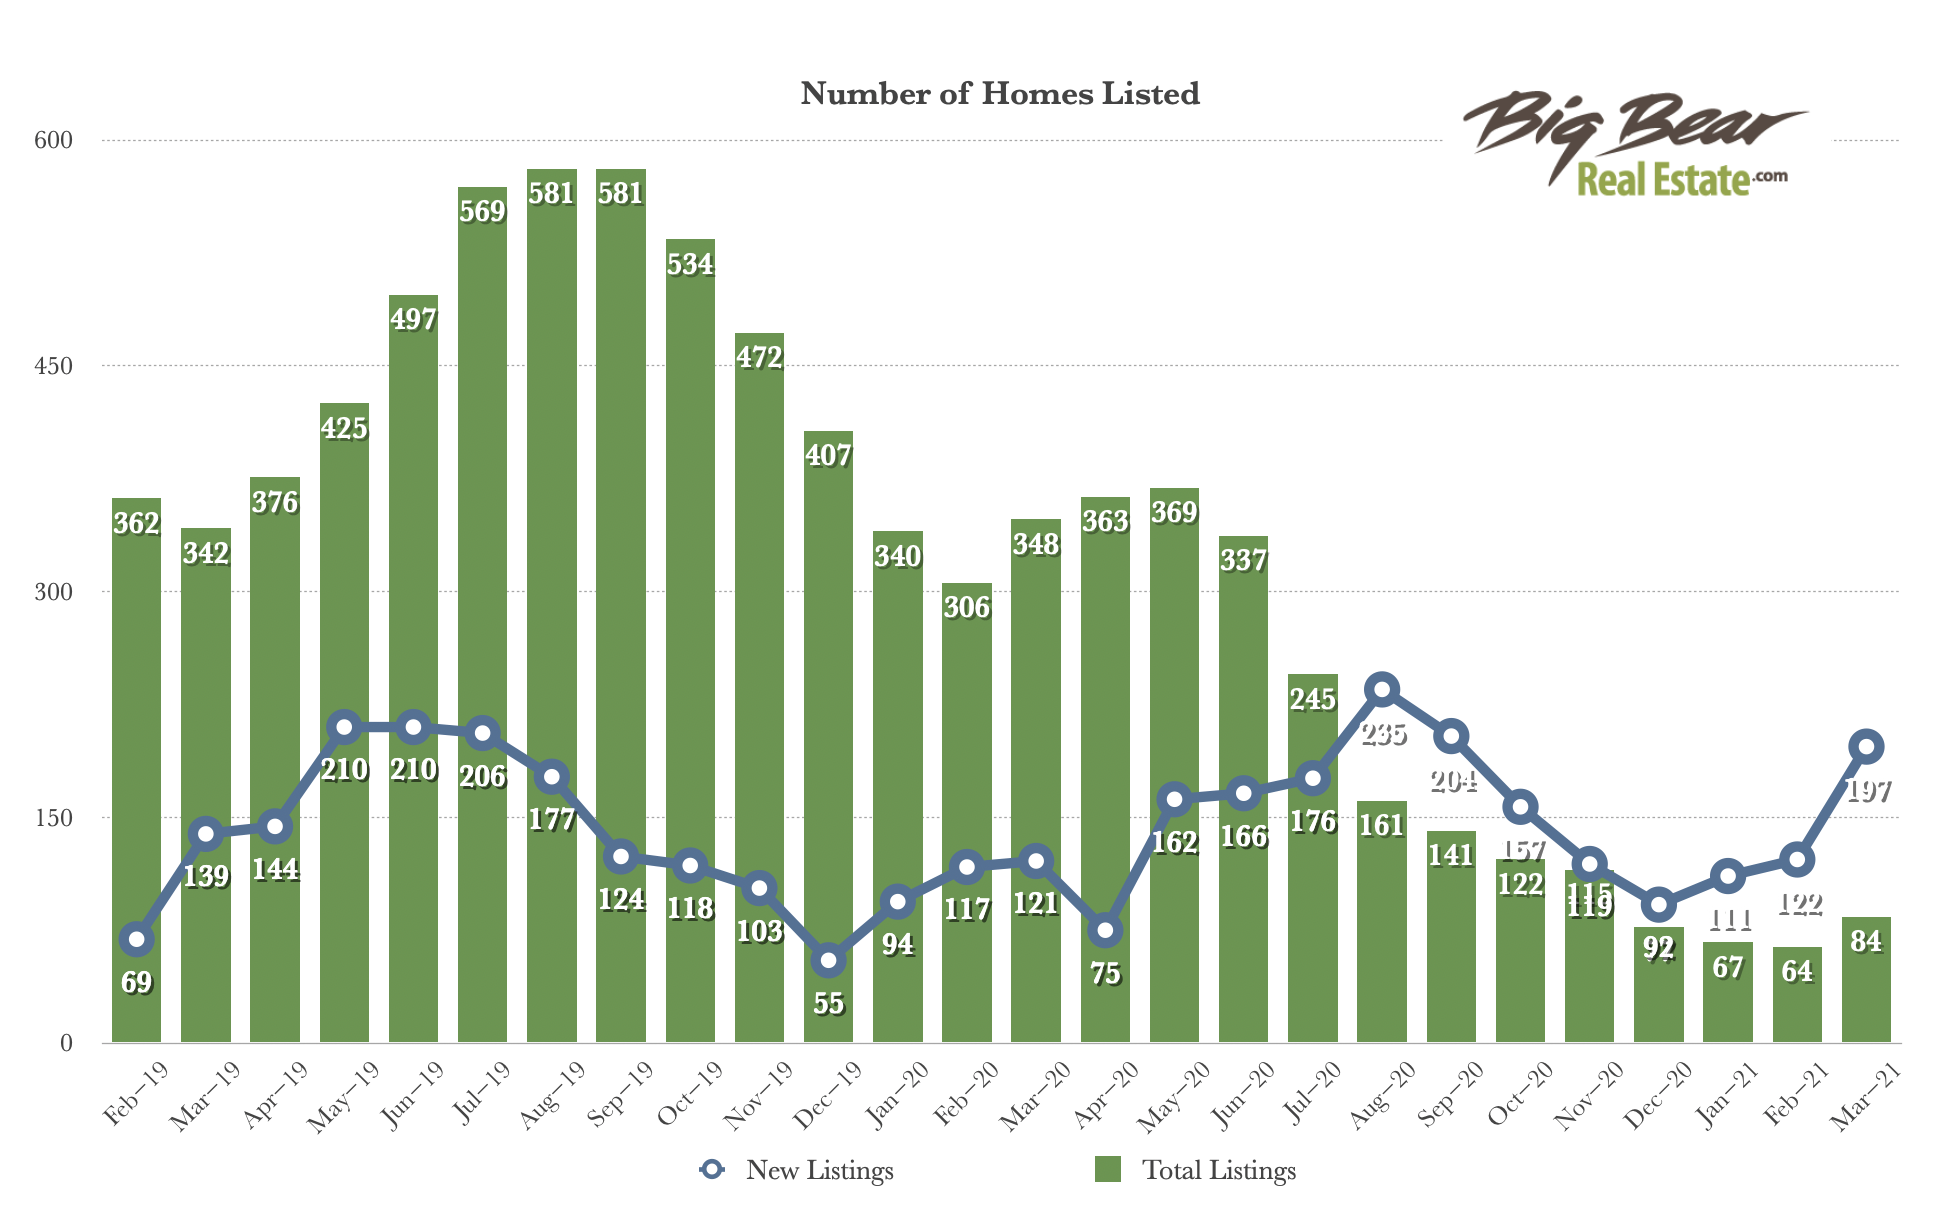
Total inventory* was up 31% month over month, and there were 75 more new listings in March than in February. The total number of homes on the market last month was about 76% less than it was in March of last year!  As of this writing, there are 111 single family homes for sale in Big Bear.inventory *Total listed inventory numbers as of the 15th of each month.
Home Prices By Quarter

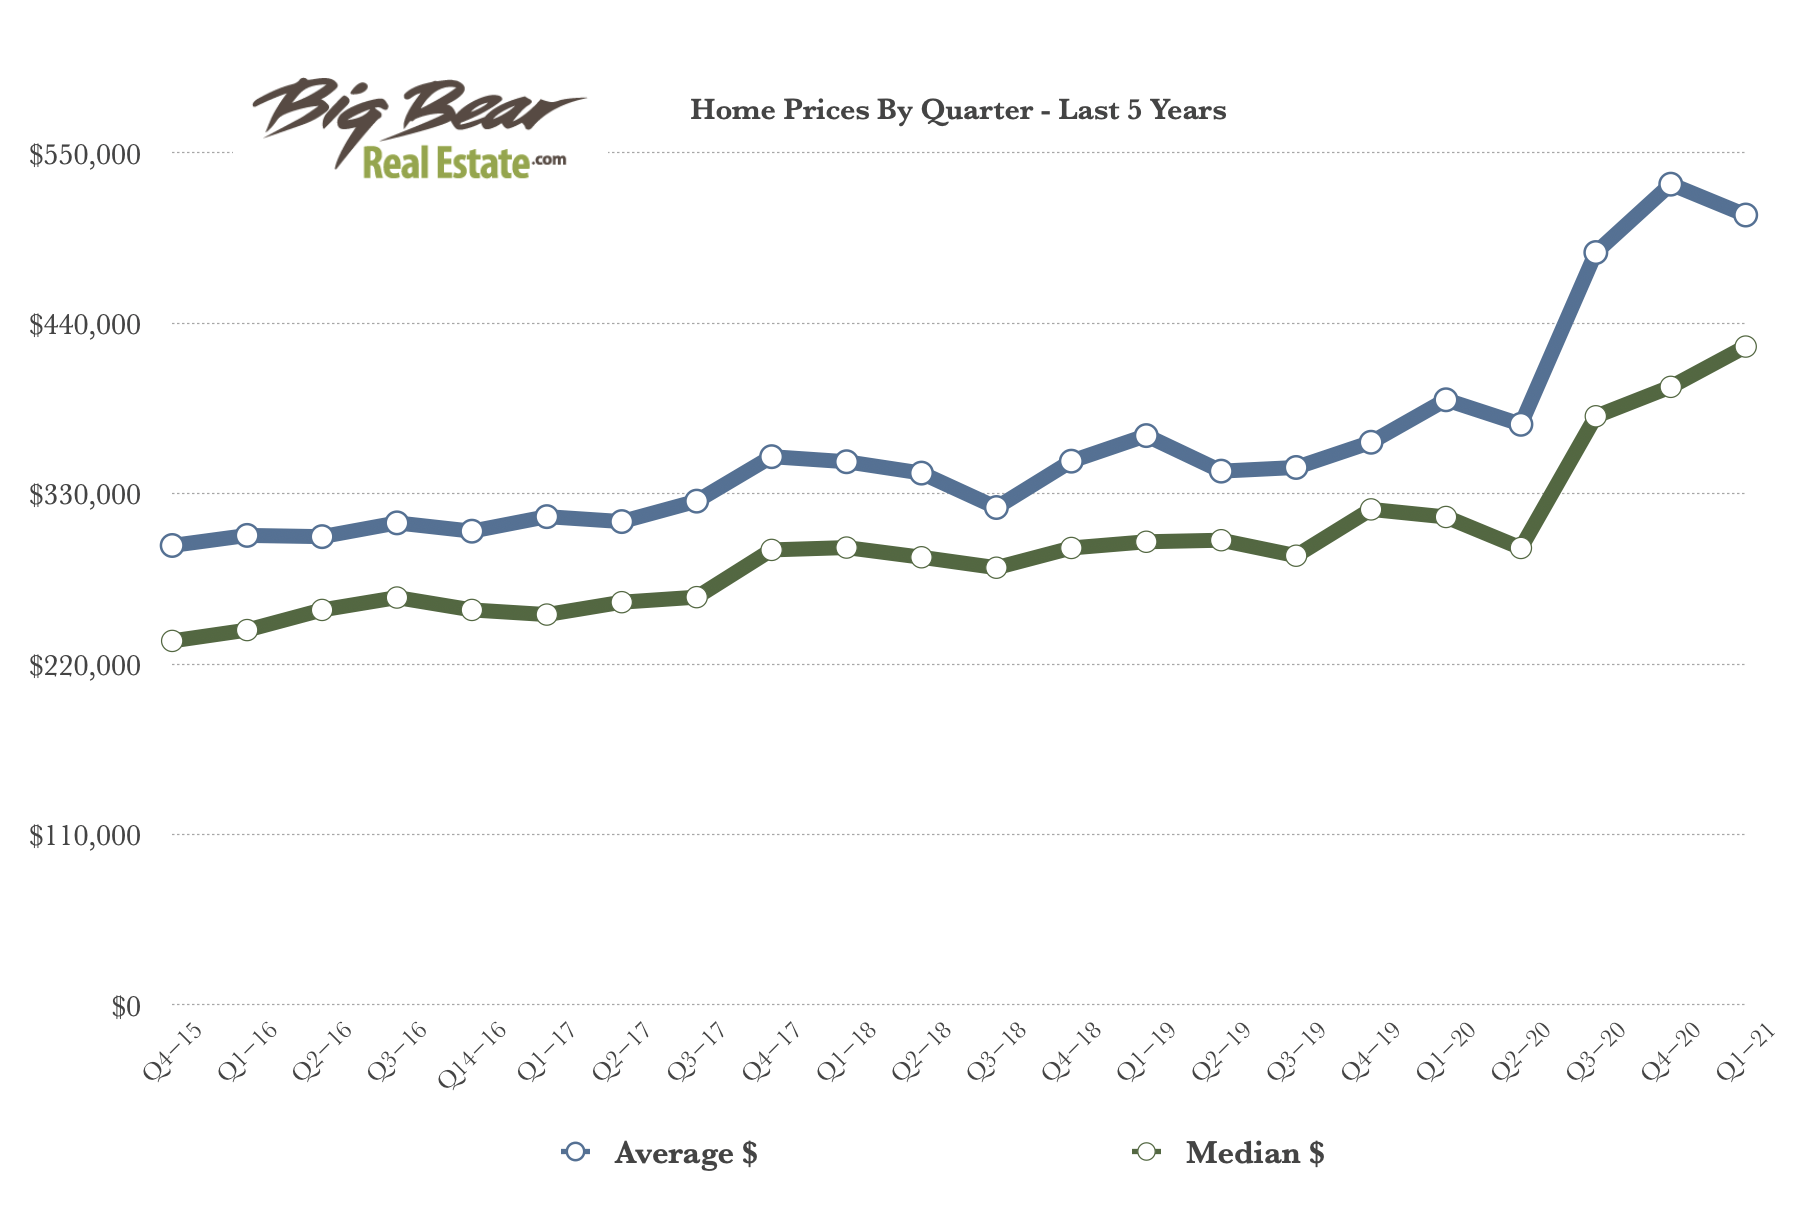
The graph below shows average and median home prices in each quarter over the past 5 years. We can see that home prices had risen fairly steadily over the last several years, and then jumped significantly after the first quarter of 2020. pricesbyqtr *Data derived from Big Bear Association of REALTORS®, Inc. (BBV) MLS. Information herein deemed reliable but not guaranteed.

Filed Under: Big Bear Market Info

Reader Interactions

Comments

  1. Sigrid Buendia says

    May 10, 2022 at 12:06 am

    great post

    Reply

Leave a Reply Cancel reply

Your email address will not be published. Required fields are marked *

Primary Sidebar

Agent Name

Area SpecialistsBig Bear Real Estate

(909) 547-7550 Contact Us
Listing Alerts Market Reports Your Home's Value

Testimonials

"Erin is an amazing Realtor. I have bought and sold 3 different properties over the past. 4 years and Erin has handled the transactions. Her professionalism,..." view testimonials
- Gordon M.
View All

Get In Touch

This field is for validation purposes and should be left unchanged.
Name(Required)
End of Modal

Contact Details

Get In Touch

This field is for validation purposes and should be left unchanged.
Name(Required)
Consent
End of Modal

Contact UsWork With a Local Expert

Whether you are buying or selling, your real estate needs are unique to you. As your local real estate experts we are here to be your guide. Contact us today - we're here to help.

Contact Us

Footer

Big Bear Real Estate

(909) 547-7550|41114 Big Bear Blvd. - PO Box 3427 (Mailing), Big Bear Lake, CA 92315 |Contact Us
Big Bear company logo Remax Big Bear company logo

DRE# 01825817   •   Privacy Policy   •  2026 All Rights Reserved