
Big Bear Real Estate Market Stats for the month of September 2023
Market Wide Summary
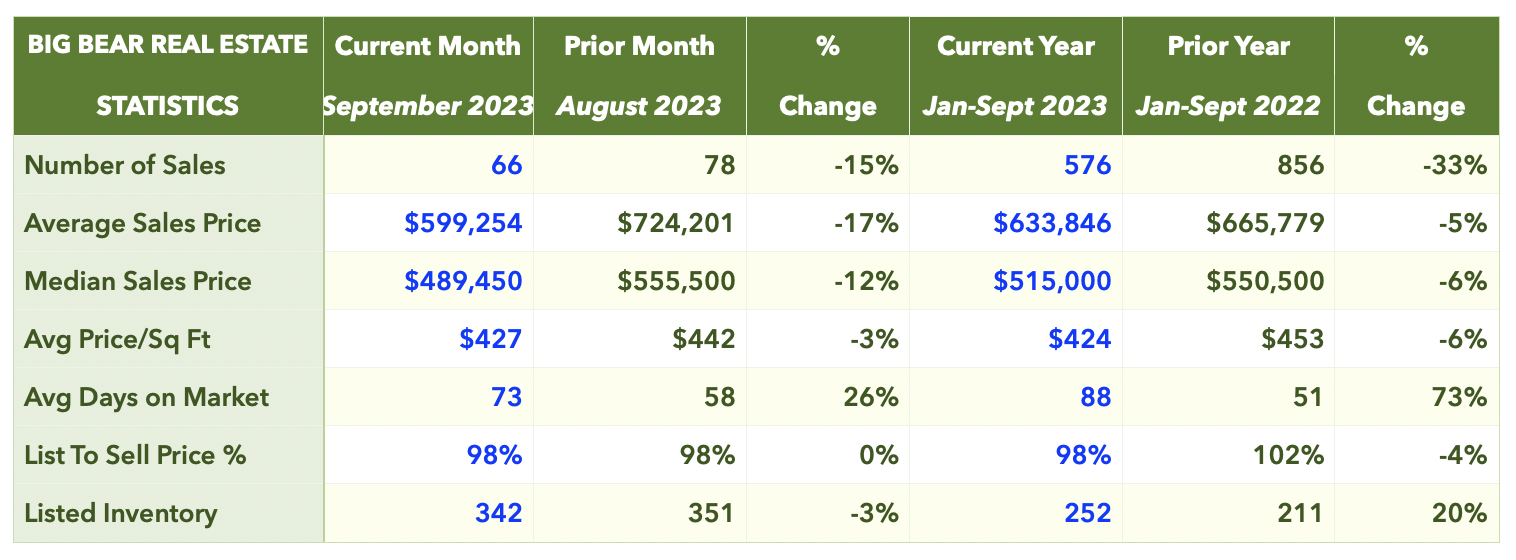
Though Big Bear real estate sales activity continues to show signs of stabilization, the market is still navigating uncharted waters. The total number of sales of single family homes was down 15% compared to the prior month. The average sales price was down 17% compared to August and the median sales price was down 12%. Average sales price over Jan-Sept 2023 was 5% lower and median sales price was 6% lower compared to Jan-Sept 2022.
List Price vs. Sale Price and Days on Market
Properties sold in September went for 98% of the asking price after 73 days on market on average, compared to 98% and 58 DOM in August. The list-to-sell price ratio was 98% on average over Jan-Sept 2023, compared to 102% over Jan-Sept 2022.
Big Bear Inventory Trends
Total inventory* was down 3% month over month, and there was an 13% decrease in new listings in September compared to August. The total number of homes on the market last month was about 9% higher than it was in September last year. As of this writing, the active inventory is at 351. 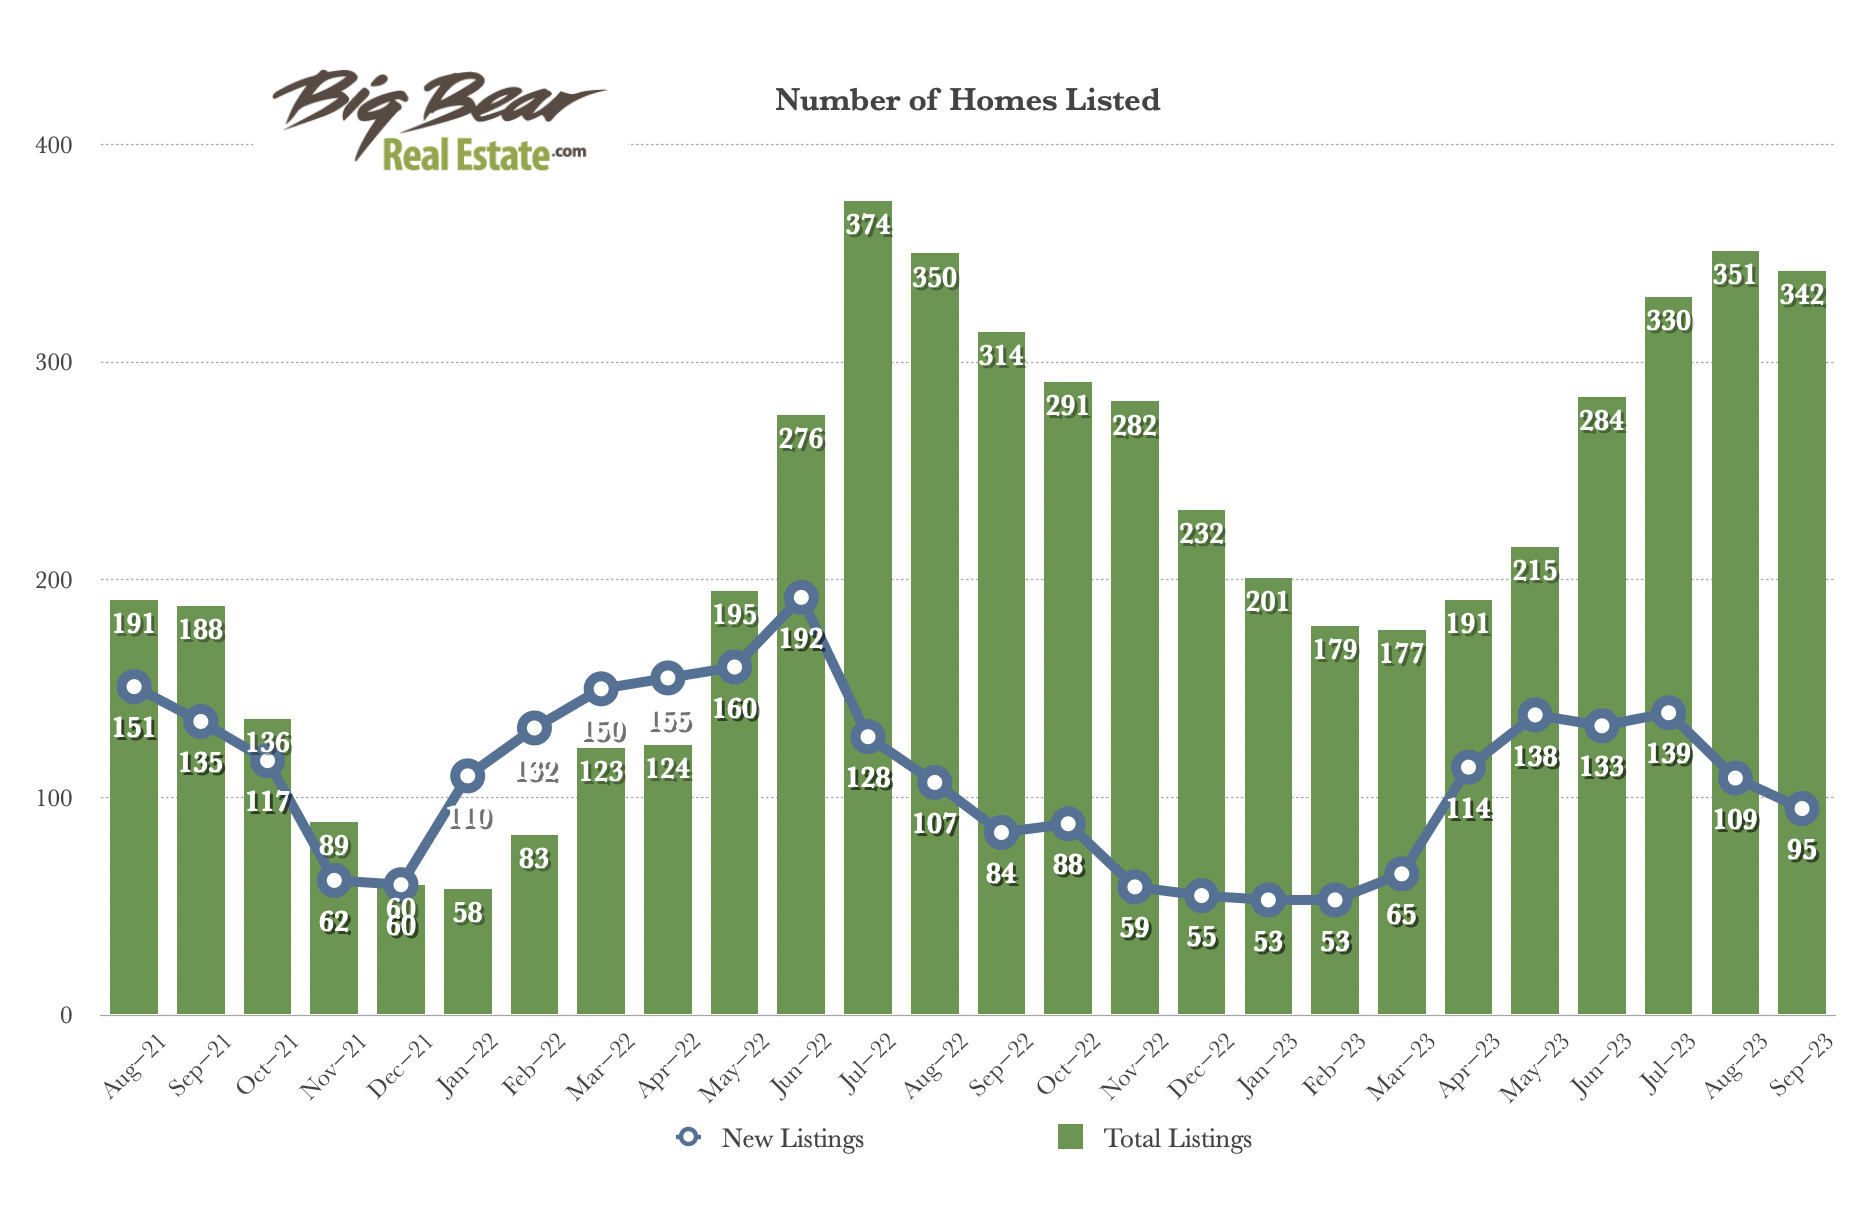 *Total listed inventory numbers as of the 15th of each month.
Closed Transactions
There were 66 sales in September, which was 33% fewer than in September 2022. The total number of sales Jan-Sept was 33% lower compared to sales Jan-Sept 2022. 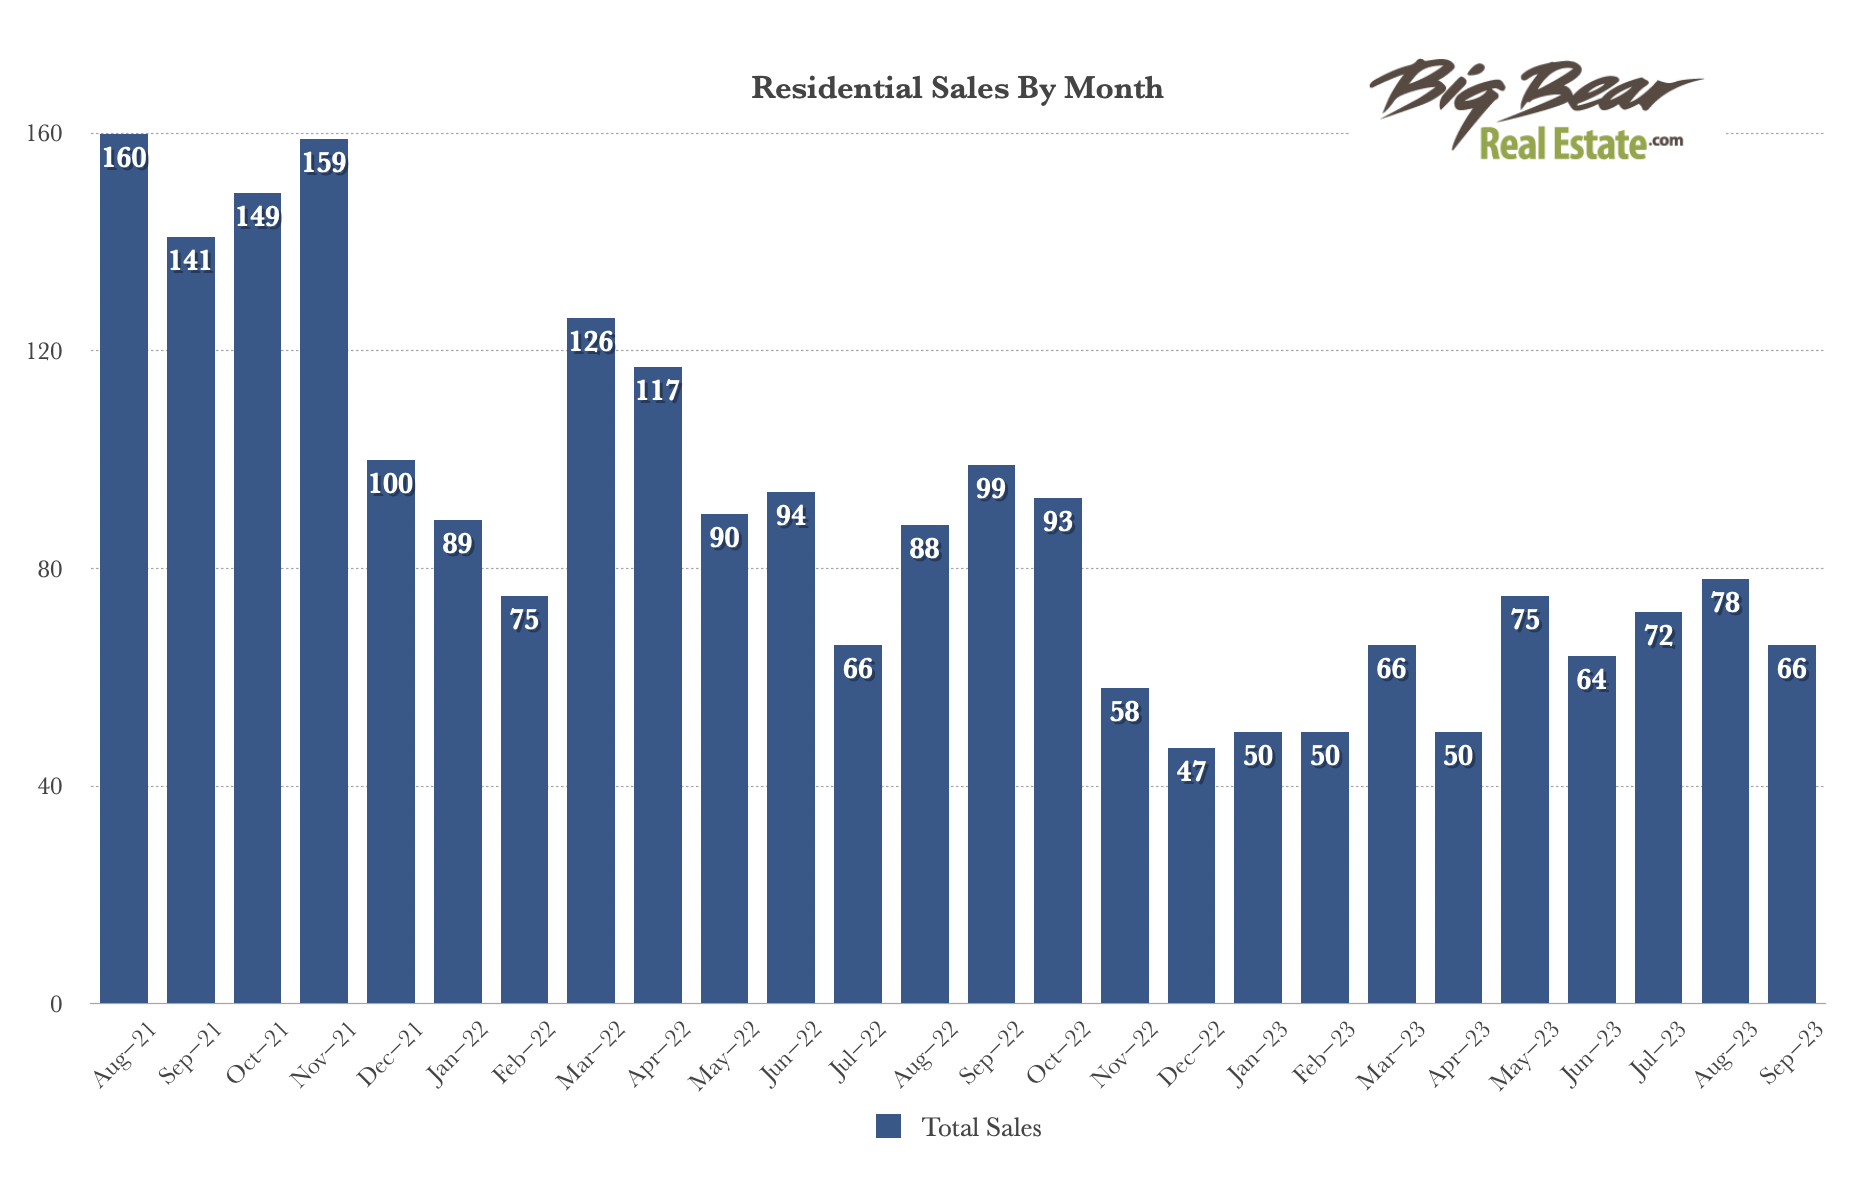
Home Prices By Quarter
The graph below shows average and median home prices in each quarter since Q2 2018. We can see that home prices increased significantly beginning the second quarter of 2020, then started trending down after a peak in Q1 of last year, until Q4 2022 when prices started trending up again. 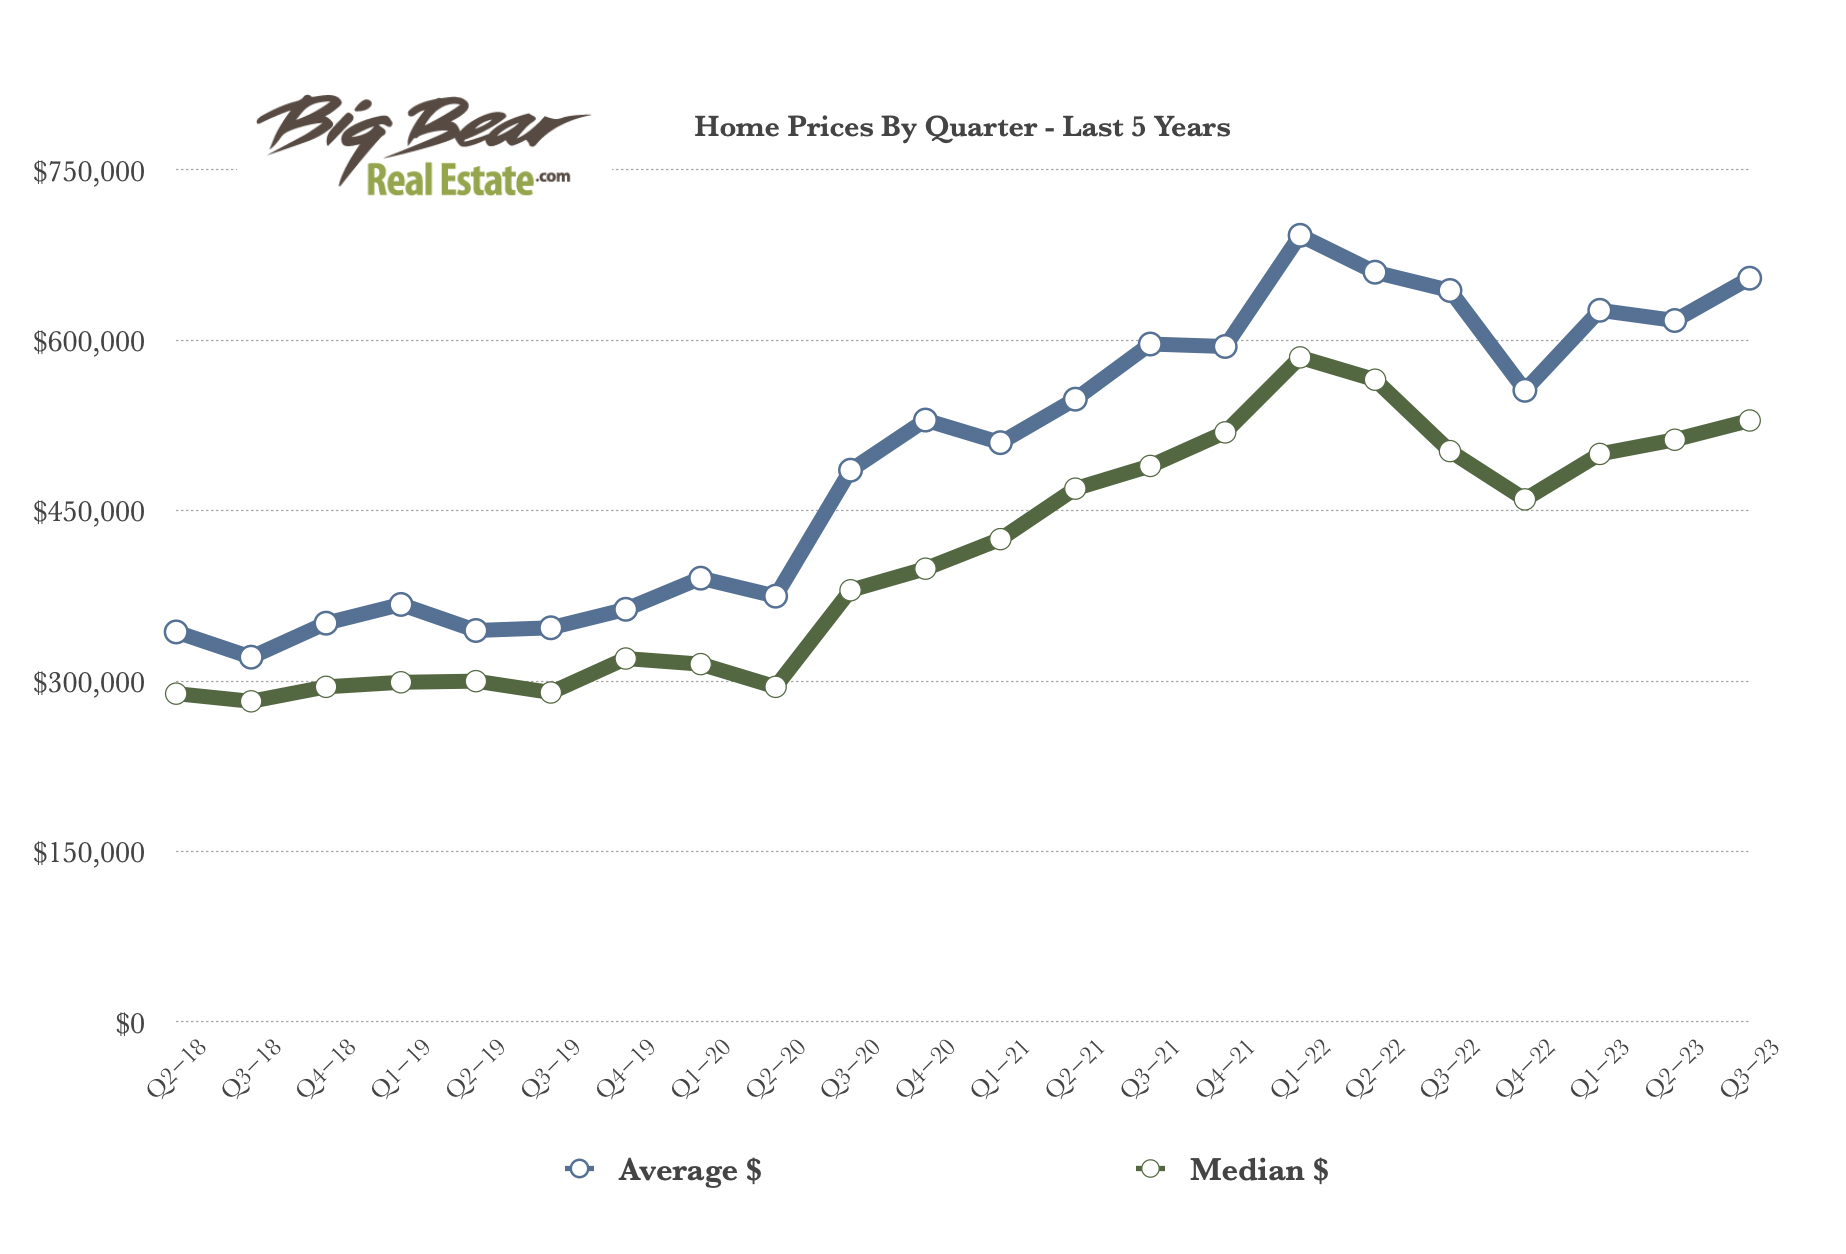 *Data derived from Big Bear Association of REALTORS®, Inc. (BBV) MLS. Information herein deemed reliable but not guaranteed.


Leave a Reply